http://www.hrcentro.com/umr/jawa_barat/kota_tasikmalaya/all
Monday, 28 December 2015
Thursday, 24 December 2015
copy file android with adb
https://www.youtube.com/watch?v=NaK5OxUeDKM
http://highonandroid.com/android-roms/how-to-copy-files-over-to-your-android-in-a-bootloop-with-no-os-using-adb/
>> adb devices
>> adb push recovery.img /sdcard/
nb : recovery.img ( file yang akan dicopy )
/sdcard destination
http://highonandroid.com/android-roms/how-to-copy-files-over-to-your-android-in-a-bootloop-with-no-os-using-adb/
>> adb devices
>> adb push recovery.img /sdcard/
nb : recovery.img ( file yang akan dicopy )
/sdcard destination
xiomi mi4c
install gapps buat xiomi mi4c
http://forum.xda-developers.com/showpost.php?p=58047099&postcount=1
http://opengapps.org/
fastboot install tutorial
http://en.miui.com/a-234.html
http://en.miui.com/thread-142056-1-1.html
Sunday, 13 December 2015
download ebook gratis
http://jogjastudent.com/7-situsweb-yang-menyediakan-jutaan-e-book-gratis-dan-legal/
Friday, 11 December 2015
open port firewal zabbix
iptables -I INPUT 5 -p tcp -m tcp --dport 10050 -j ACCEPT
service iptables save
link referensi
service iptables save
link referensi
Thursday, 10 December 2015
install zabbix
link referensi
https://sathisharthars.wordpress.com/tag/zabbix-agent/
link
li
Configuring Zabbix (Monitoring tool)

Zabbix is the ultimate open source availability and performance monitoring solution. Zabbix offers advanced monitoring, alerting, and visualization features today which are missing in other monitoring systems, even some of the best commercial ones.
Below is a short list of features available in Zabbix:
Below is a short list of features available in Zabbix:
- auto-discovery of servers and network devices.
- low-level discovery.
- distributed monitoring with centralized web administration.
- support for both polling and trapping mechanisms
- server software for Linux, Solaris, HP-UX, AIX, FreeBSD, OpenBSD, OS X
- native high performance agents (client software for Linux, Solaris, HP-UX, AIX, FreeBSD, OpenBSD, OS X, Tru64/OSF1, Windows NT4.0, Windows 2000, Windows 2003, Windows XP, Windows Vista)
- agent-less monitoring
- secure user authentication
- flexible user permissions
- web-based interface
- flexible e-mail notification of predefined events
- high-level (business) view of monitored resources
- audit log
Advantages of Zabbix comparing to other moimtoring tools:
- Availability Monitoring (like Nagios) and graphing (like Cacti) is combined into one tool.
- Highly configurable. User John may just get an SMS for problems of high severity during the weekend and on weekdays get a Jabber message. Even automatic actions like restarting services can be set up.
- The notifications actually help the person who gets the message. “Low disk space on /var on web5” with an additional comment is pretty helpful even when sent via SMS. Notifications are completely customizable with macro variables.
- Very performant. A Zabbix agent can be installed on the systems (available for several operating systems – even for Windows) which gathers the information on each system efficiently. The agent can even call scripts or shell one-liners to gather information. This kind of data collection is very efficient. You will need a server with a good I/O performance and a lot of RAM though so that the database can work efficiently.
- Collecting items (gather information about system parameters) happens at set intervals. You don’t have to wait for several minutes until you see results (it usually takes half a minute). Each item can have a custom check interval. So you can check for the CPU load every 30 seconds but check the number of free inodes on /home just once an hour.
- Fast web interface.
- Sophisticated monitoring of web sites. Zabbix can follow a path of simulated mouse clicks on a web site and check for functionality and response time.
- Real-time graphs. Values are by default collected every 30 seconds. You quickly see where you are going.
- Permissions system. Certain users can be limited to certain views.
- Gathered data is stored in a database (MySQL, PostgreSQL, SQLite) instead of an unflexible RRD file. Storage periods (aka “history”) can be configured freely. Backing up the database is all there is to be done.
- Templates (that can even link to further templates) save time in setting up many checks.
- Graphs (plots of values over time) can be customized like which items are plotted and in what way. Even pie charts are possible.
- Even the parameters that don’t get an explicit graph can be graphed at any time.
- Screens and slide shows can be used for high-level views (aka “dashboards”) or to be displayed on a big geeky display. They can combine textual display of the status as well as clocks, ad-hoc graphs or predefined graphs.
- Very flexible trigger expressions. For example you can tell a trigger to fire if the average system load over the last 15 minutes is above a certain value. As all measured parameters are stored in a backend database you can use all kinds of mathemical expressions. Like firing a trigger if the average number of running processes during the last half hour is above 50.
- Alerting/notifications can be scripted easily by using shell scripts.
- Remote monitoring made easy by using a Zabbix proxy.
- Paid support and paid custom programming available. But the software is completely open-sourced.
Installation:
# yum –enablerepo=epel -y install zabbix-server-mysql zabbix-agent zabbix-web-mysql
# mysql -u root -p
# mysql > create database zabbix;
# mysql > grant all privileges on zabbix.* to zabbix@localhost identified by ‘password’;
# mysql > flush privileges;
# mysql > exit
# mysql > grant all privileges on zabbix.* to zabbix@localhost identified by ‘password’;
# mysql > flush privileges;
# mysql > exit

# cd /usr/share/doc/zabbix-server-mysql-*/create
# cat mysql.sql | mysql -u root -p zabbix
# cat data.sql | mysql -u root -p zabbix
# cat images.sql | mysql -u root -p zabbix
# vi /etc/zabbix/zabbix_server.conf
DBPassword=password


# vi /etc/httpd/conf.d/zabbix.conf
Alias /zabbix /usr/share/zabbix
<Directory “/usr/share/zabbix”>
Options FollowSymLinks
AllowOverride None
Order allow,deny
Allow from 192.168.31.0/24
max_execution_time = 600
max_input_time = 600
memory_limit = 256M
post_max_size = 32M
upload_max_filesize = 16M
date.timezone = Asia/Kolkata
</Directory>
max_input_time = 600
memory_limit = 256M
post_max_size = 32M
upload_max_filesize = 16M
date.timezone = Asia/Kolkata
</Directory>

# /etc/rc.d/init.d/zabbix-server start
# /etc/rc.d/init.d/zabbix-agent start
# /etc/rc.d/init.d/httpd restart
# chkconfig zabbix-server on
# chkconfig zabbix-agent on

Zabbix Setup:
Access to “http://(hostname or IP address)/zabbix/” .
Check a box “I agree” and go next.

Make sure all are OK and go next.

Change to “zabbix in “User” field and input the password. Next, click “Test Connection” and id it’s “OK” like follows, go next.

Input ZABBIX server’s hostname and so on like follows.

Make sure settings and if it’s Ok all, go next.

Make sure “OK” and go next.
Click “Finish” to complete.

Login with a user “admin” and default password is “zabbix”.

Just logined. Initial settings just completes.

Change default admin password and set admin’s email address:
Login to ZABBIX admin site and click “Profile” that is placed at the Upper right.
Click “Change Password”.

Input any password you’d like to set. Furthermore, click “Add” button in “Media” field to set admin’s emaill address.

Input email address for admin and click “Add” button.

Click “Save” button that is placed at lower right and finish.

Basic monitoring setting for ZABBIX.
Login to ZABBIX admin site and click “Configuration”-“Hosts”. Then addedd hosts are listed like follows. Check a box of a host you’d like to enabled and select “Activate selected”, and then Click “Go” button.


The “Status” turn to “Monitored” and monitoring is enabled.


It’s possible to see server’s status on graphs to click “Monitoring”-“Screens” like follows.

Some items of monitoring are enabled by default but maybe it’s not running on your server, those items are looked as ploblems but it’s not. Then turn them disabled to monitor.

The status is shown on “Monitoring”-“Dashboard” section ,Click “Configuration”-“Hosts” and then click “Items”.

Check a box to monitoring targets and select “Disable Selected”, and then click “Go” button.
Configure Alart notification if ploblems. For example, set Alart notification when httpd is down.
Set target email address first. Click “Administration”-“Media Types” and next, Click “Email”. and Set mail server you use like follows and save the settings.

Open “Configuration”-“Actions” and click “Create Action” button on upper right.

Input any name and click “New” button in “Action operations” field.


The screen like follows are opened, then click “Select” button in “Send message to” field, and next, select “Zabbix administrators” on the list. Next, select “Email” in “send only to” field and finally click “Add” button.


Click in “Action Conditions” on the top
Select “Trigger” and Click “Select” on the right, then select “Apache is not running on Zabbix server” on the list. Finally click “Add” button.

Check boxes for “Action operations” and “Action Conditions” and Click “Save” button to finish.

Try to stop httpd manually, then alart notification is sent to the email address you set like follows.
Adding other hosts for monitor target:
Install ZABBIX Agent on a host you’d like to monitor. For example, add a Centos 6 host for monitoring.
Adding other hosts for monitor target:
Install ZABBIX Agent on a host you’d like to monitor. For example, add a Centos 6 host for monitoring.
# yum –enablerepo=epel -y install zabbix-agent
# vi /etc/zabbix/zabbix_agentd.conf
Server=192.168.31.1
Hostname=arthar.arthar.com
# /etc/rc.d/init.d/zabbix-agent start
# chkconfig zabbix-agent on
Server=192.168.31.1
Hostname=arthar.arthar.com
# /etc/rc.d/init.d/zabbix-agent start
# chkconfig zabbix-agent on

Login to ZABBIX admin site and open “Configuration”-“Hosts”, then click “Create Host” button. and Input any name, you DNS name, target IP address. Next,scroll to right.

Click “Add” button in “Linked templates” field. and The screen like follows is shown, then select “all” in “Group” field on upper right and next, check a box in for “Template_Linux”, finally click “Select” button.

Check a box for the template you added and click “Save” button on the bottom to finish.
The host you added is just shown and it is monitored like follows.

Adding Windows host for minotoring target:
This example shows to add Windows 7. It’s necessary to open 10050 port on Windows firewall before settings.
Download binary for Windows from the site below.
http://www.zabbix.jp/binaries/zabbix/zabbix-1.8/windows/
After dowloading, install it.
Login to ZABBIX admin site and open “Configuration”-“Hosts” and then click “Create Host” button.
Download binary for Windows from the site below.
http://www.zabbix.jp/binaries/zabbix/zabbix-1.8/windows/
After dowloading, install it.
Login to ZABBIX admin site and open “Configuration”-“Hosts” and then click “Create Host” button.
Input any name, you DNS name, target IP address. Next,scroll to right.
Click “Add” button in “Linked templates” field.
The screen like follows is shown, then select “all” in “Group” field on upper right and next, check a box in for “Template_Windows”, finally click “Select” button.
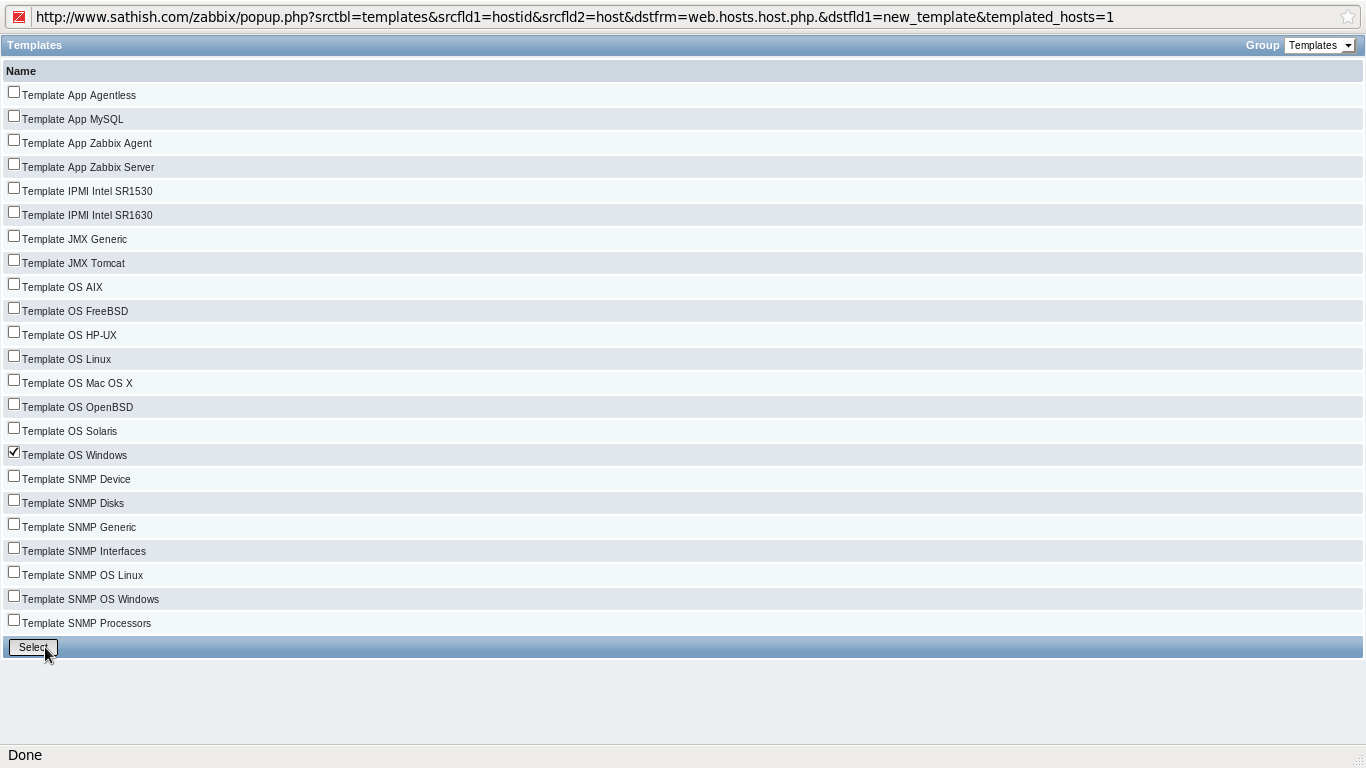
Check a box for the template you added and click “Save” button on the bottom to finish.
Windows host is just added.

Post Images


TRANSLATOR
.
Creative Commons
 Latest Vulnerabilities
Live Traffic
- Security News


Subscribe to:
Posts (Atom)